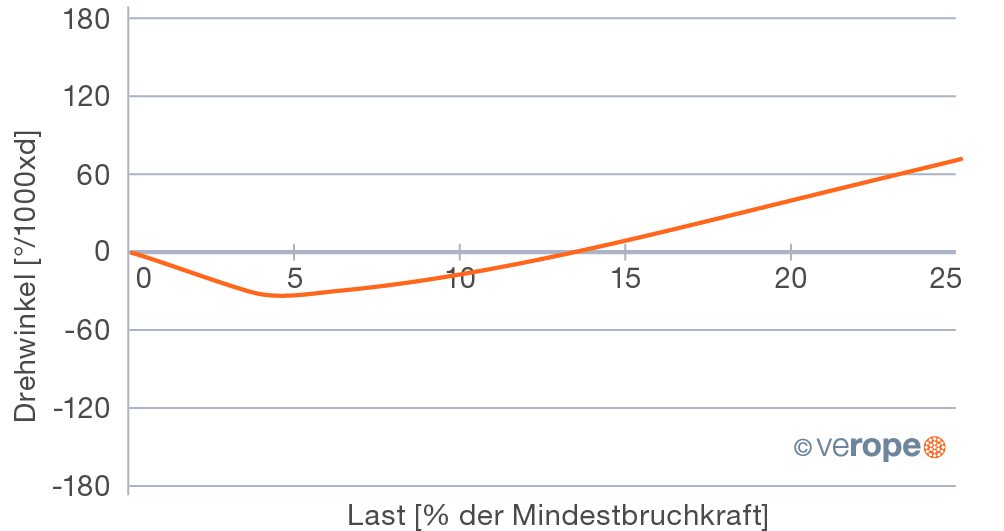
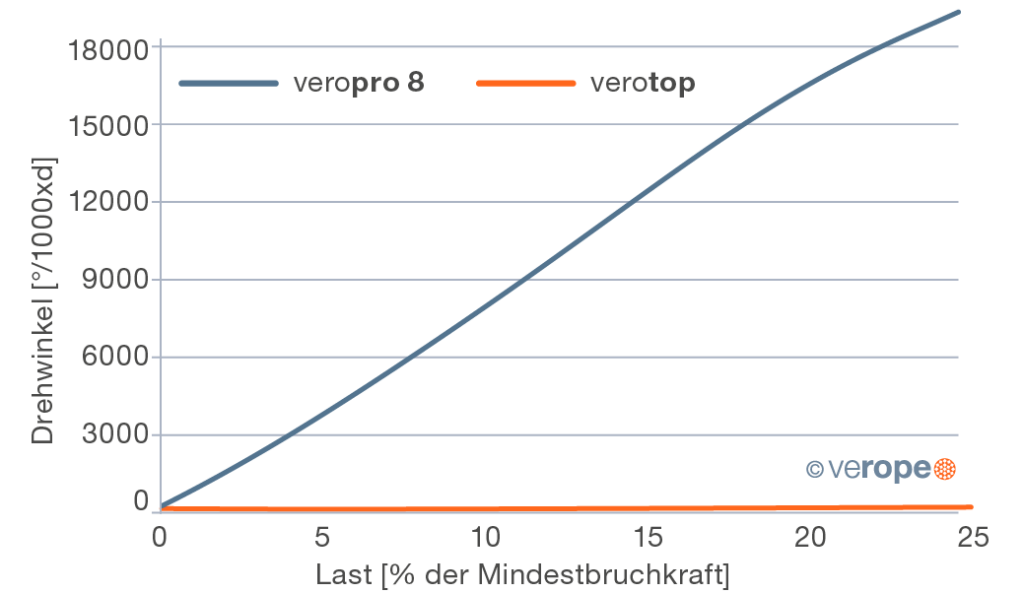
To evaluate the rotational behavior of a wire rope the rope torque and the rotation angle are measured. For the measurement of the rotation angle a smooth swivel is fastened at the end of the rope. During the test the twist of the rope is measured in dependence of the load. The twist usually is given in degree per 1000 x rope diameter. To measure the rope torque both rope ends are protected against twisting. At one end of the rope the rope torque in dependence of the load is measured, with which the rope wants to twist the end-fitting.
Flexibility
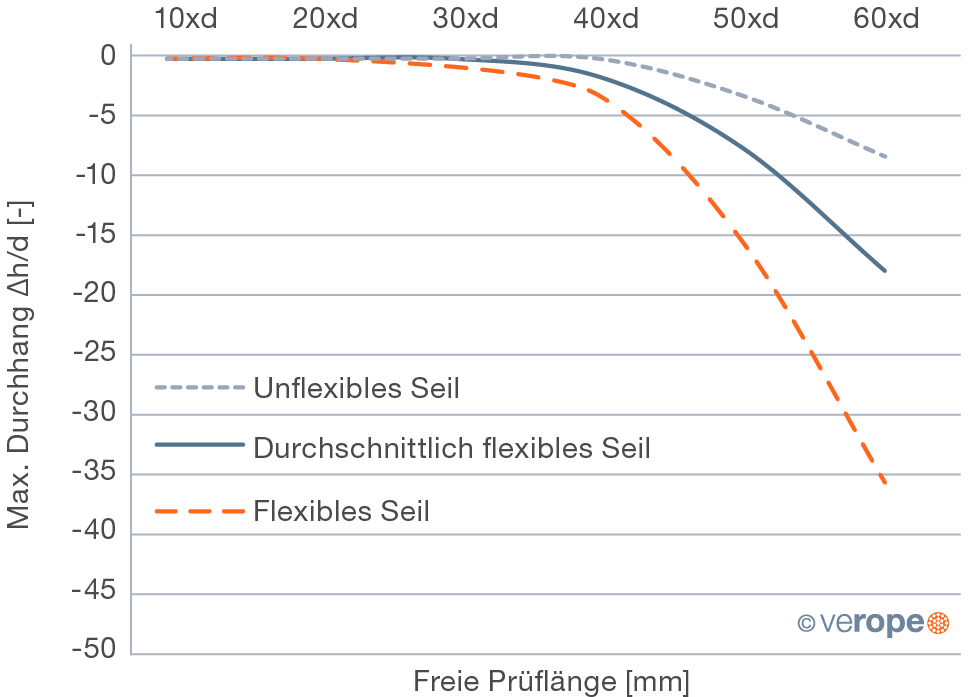
The flexibility of a rope is a measure of how easily a rope allows itself to bend around a given diameter. The flexibility of a rope is among other things dependent on the line pull. The flexibility of an unloaded rope can be measured by the sag of a rope under its own weight. Figure 67 shows the maximum sag of the rope for different free rope lengths (expressed as a multiple of the rope diameter). The flexibility of ropes under load is measured as the efficiency factor of the rope while running over a sheave.
Efficiency Factor
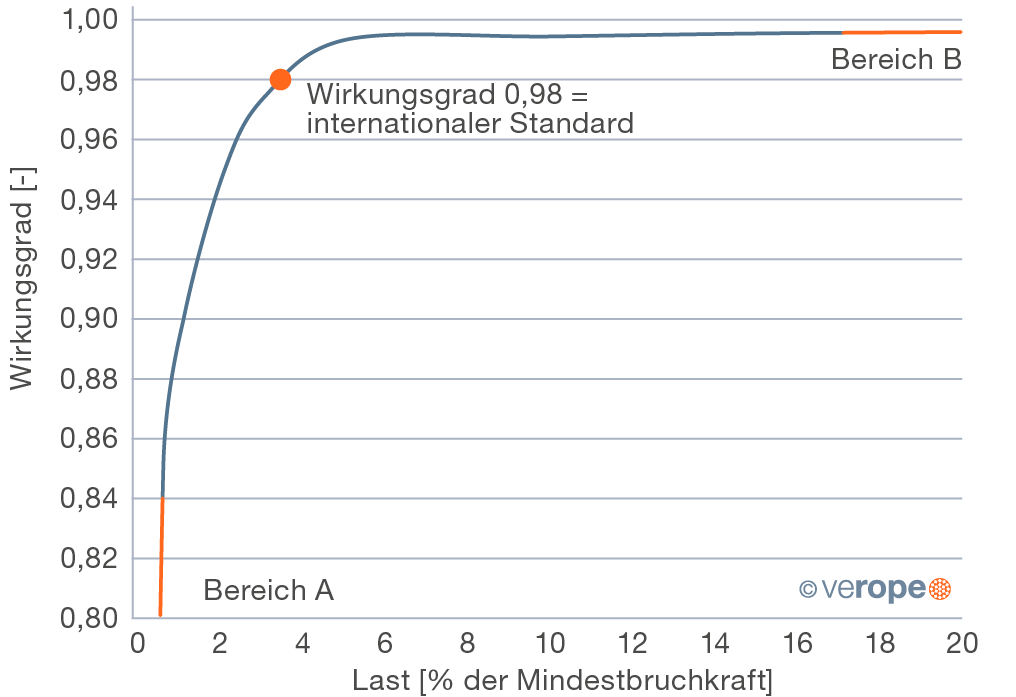
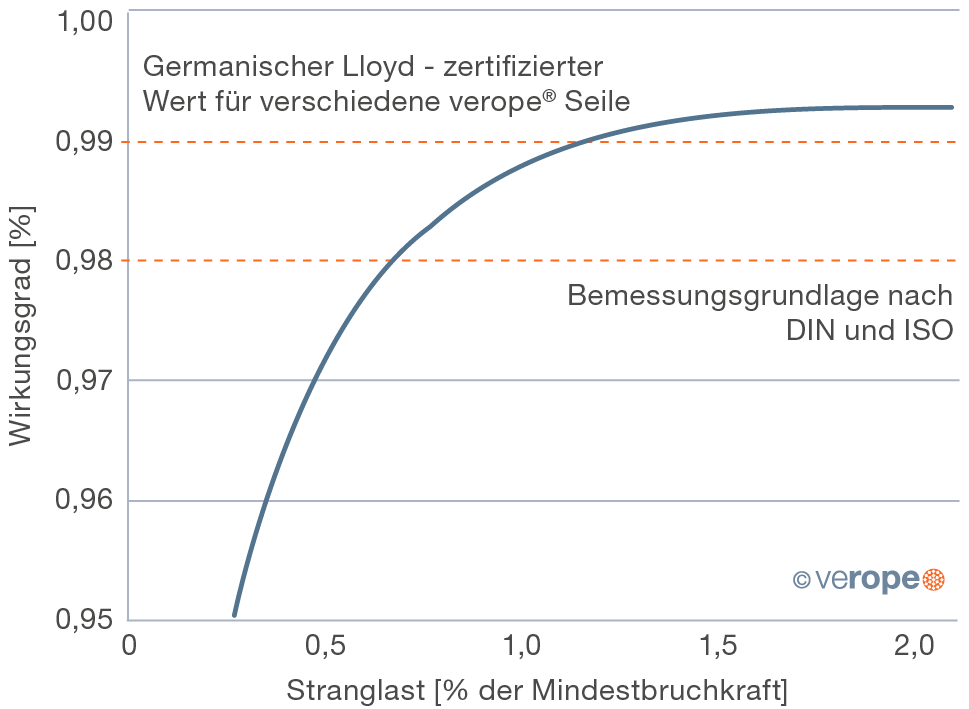
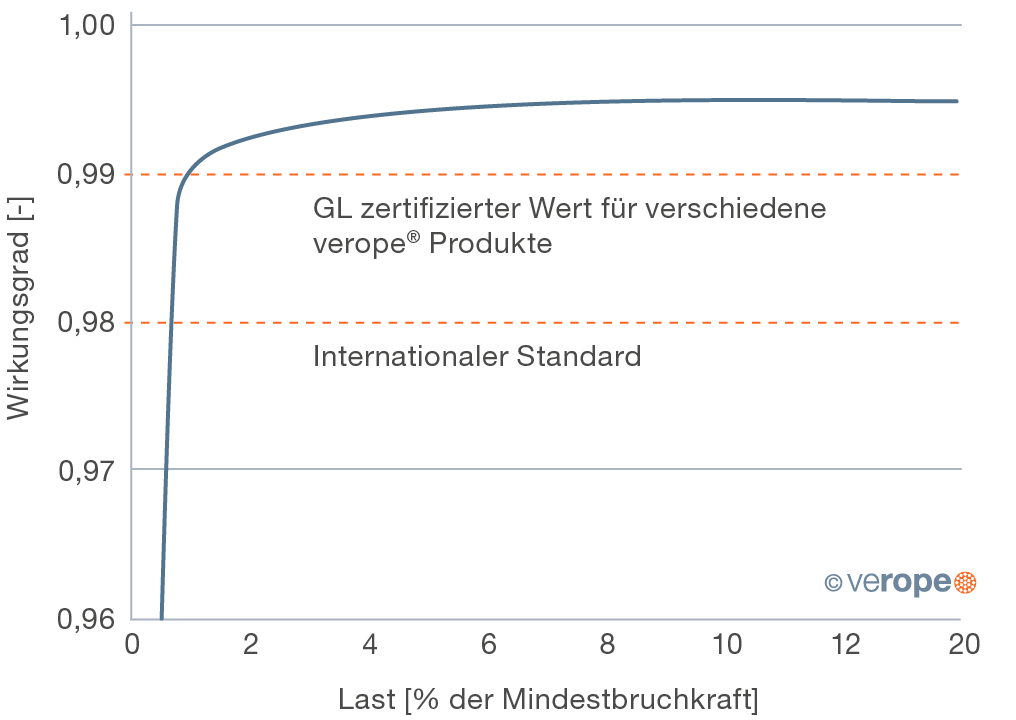
Figure 68 shows a typical diagram of a rope efficiency factor under line pull. In many specified standards one finds the reference, that for dimensioning a reeving system using roller bearings it should be calculated with an efficiency factor of 0.98, this value is marked in figure 68. However, the designer of a reeving system needs the efficiency factor under high line pulls (area B in the diagram, here the efficiency factor is higher than 0.98) for the calculation of the required drive power. In order to calculate the minimum weight of the unloaded bottom hook block the designer needs the efficiency factor under relatively low line pulls (area A in the diagram, here the efficiency factor is clearly lower than 0.98). To help the designer in his interpretation, verope measures the efficiency factor of its products in the low-load range and in the range of high loads with high accuracy (figure 69 & 70).
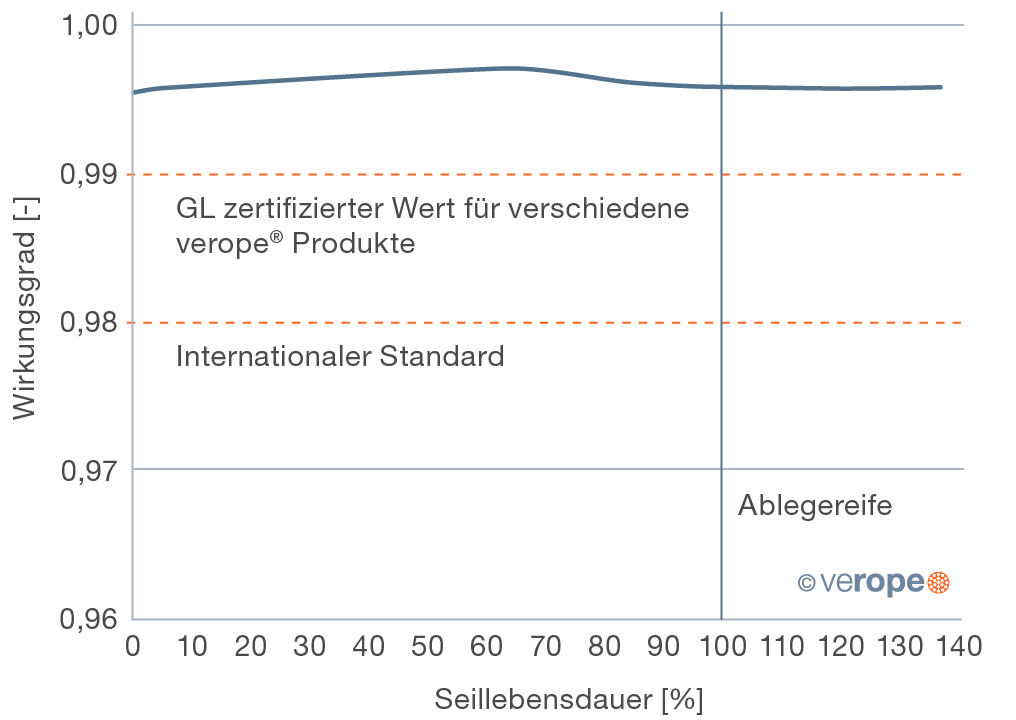
As the very first special wire rope manufacturer, verope has measured the efficiency factor of its products over the lifetime of the ropes. Typically the efficiency factor of the rope improves first over the lifetime and drops later to reach the initial value at discard. Figure 71 shows a typical example. Under higher loads the efficiency factor of verope special wire ropes with a D/d ratio of 20 or higher lies demonstrably above 0.99. Therefore shall for example cranes that are certified by Germanischer Lloyd using various verope special wire ropes be interpreted with an efficiency factor of 0.99.
Please contact us for further details.